Body Composition Analysis with the InBody 270
Warning: People who should NOT use the InBody 270 include…
Anyone who has an implantable electrical device such as Pacemaker, Defibrillator, Nerve Stimulator, or women within the first twelve weeks of pregnancy is recommended not to use the device.
Things to keep in mind for the accurate measurement with InBody 270
- Preferably the test should be carried out on an empty stomach & bladder
- Testing should be carried out before exercise
- Testing should not be carried out after a shower or using a sauna as sweat & heat causes a temporary change in conductivity within the body
- Subsequent testing should be carried out under similar conditions. (i.e. similar clothing, testing time, before eating or exercising etc.)
- Inputting of age and gender is needed to gain ‘normalized’ ranges for comparison, it does not affect the measurement. Height needs to be inputted accurately as it will effect the measurement
- Arms need to be away from the side of the body. Not touching body
Age Range 3 years to 99 years
Weight Range 10 to 250 kg (max 39.5 stone)
Understanding the readouts and measurements on your InBody report
1. Body Composition Analysis
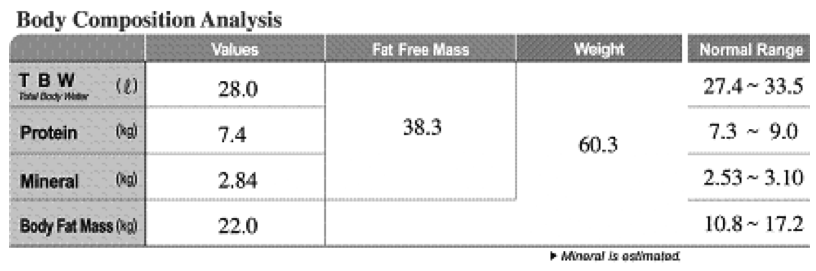
InBody 270 gives a value for the various body compartments which equals the weight of each compartment, when added together they equal the person’s weight. The values can also be compared with the ‘normal’ values.
Total Body Water (TBW)
InBody 270 measures TBW. Total Body Water = All the water in the body and is approx 60% of total weight.
Protein
Protein consists of nitrogen and is the main component of Soft Lean Mass. A lack of protein implies a lack of muscle and / or poor nutrition.
Mineral
InBody analyses two groups of minerals: osseous mineral and non-osseous minerals. Osseous mineral is bone mineral whereas non-osseous minerals are those found in all other parts of the body. Osseous mineral accounts for about 80% of the body’s total minerals.
Mineral mass is closely related to soft lean mass. If you have more lean mass, the weight of bones strengthen which in turn, increases the bone mineral. InBody 270 gives an estimate of bone mineral. It can be used as a screening tool to detect changes in bone mineral. Low bone mineral is associated with Osteoporosis
Body Fat Mass
Body Fat Mass can be stored under the skin, as well as in the abdomen. When a persons body fat mass is higher than the standard range, they are said to be clinically obese.
Weight
Weight consists of body water, protein, mineral and body fat mass.
Weight = Total Body Water + Protein Mass + Mineral Mass + Body Fat Mass.
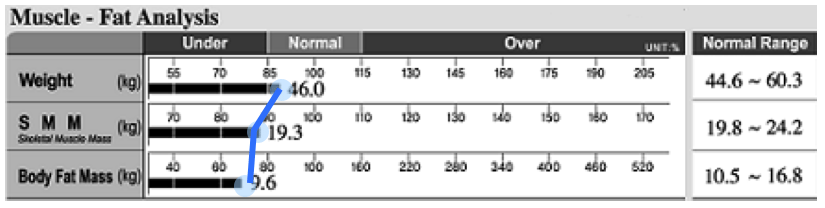
2.Muscle : Fat Analysis
The Muscle : Fat Analysis consists of a comparison of weight, skeletal muscle mass, and body fat mass.
Weight (kg)
The 100% normal weight refers to the ideal weight for a person given his/her height. It is calculated using the BMI standard weight calculation method. NB Ideal Weight differs from target weight.
Skeletal Muscle Mass (kg)
100% normal Skeletal Muscle Mass refers to the ideal quantity of Skeletal Muscle Mass for a person’s standard weight.
There are three types of muscle – cardiac muscle, visceral muscle and skeletal muscle. However, it is the quantity of skeletal muscle that is the most changed through exercise. As such, InBody270 displays Skeletal Muscle Mass separately from Soft Lean Mass.
Body Fat Mass (kg)
100% normal Body Fat Mass refers to the Body Fat Mass that a person should maintain for his/her standard weight.
HOW TO READ AND INTERPRET YOUR RESULT
Draw a line joining the end of each bar graph line.
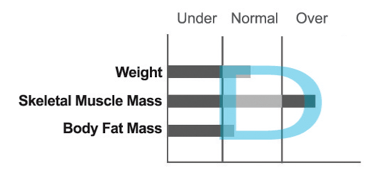
Different body types, based on a balanced body composition.
In the case of this body type, the body composition graphs form a slightly curved ‘D’. This is the ideal body composition state.
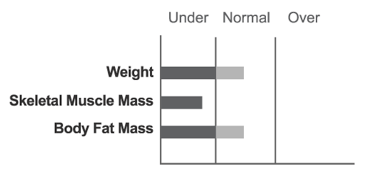
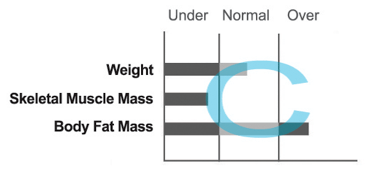 At the opposite end of the health spectrum, we find the following graph shape, a ‘C’ shape. In this case, the person’s weight is within the normal range. However their Muscle mass is low and body fat mass is high. This person may be recommended to achieve a ‘D’ shape by losing Body Fat Mass while gaining SMM.
 This type is exemplified by a person whose weight is within the standard range, but yet cannot be regarded as being in ideal health. For this type, the length of the SMM graph is shorter than the standard range, while the Body Fat Mass is within the standard range. An examinee of this type will also exhibit a ‘C’ shape.
However, this person should be identified as having a weak body, and not as being obese. People who belong to this type usually lack exercise and / or proper nutrition.
This person may be recommended to achieve a ‘D’ shape by gaining SMM and examining their diet.
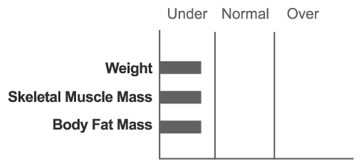 This person displays a straight line below the normal range.
They would be underweight and have a weak body. Poor nutrition like this, continuing for a long period of time, may result in health problems.
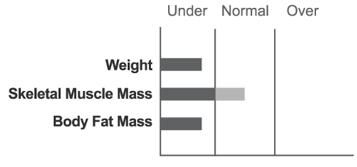 Here we have a D shape but whilst the weight is below the normal range, the skeletal muscle mass is within normal, but body fat mass is lower than normal.
However, body fat not only has an energy-storing function in our body but also assists the absorption of fat soluble vitamins, and maintains healthy skin and hair. In addition, it is an essential building block for cell membranes. Therefore this person needs to be careful not to lose more body fat.
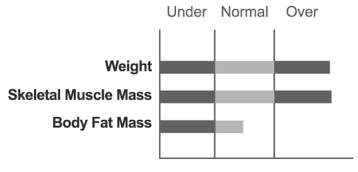 Athletes are usually included in the overweight muscle type. As such, such people can easily be included in the obese category when BMI alone is used. This person does not need to undertake weight control measures.
3. Obesity Analysis
InBody270’s obesity diagnosis uses BMI (Body Mass Index) and PBF (Percent Body Fat) to determine obesity levels.
BMI (Body Mass Index, ㎏/㎡)
The formula is BMI= Weight (kg)/Height2 (m2). BMI has been widely applied in the general medicine, dietary, and sports medicine fields as the main means of diagnosing obesity. However, this method is flawed in that it cannot be applied to adults with high levels of SMM, children, those over the age of 65, or pregnant females.
Also there can be occasions when weight is normal, but fat mass is too high and muscle mass is too low. BMI will not detect this as being a health issue.
Percent Body Fat (%)
Percent Body Fat indicates the percentage of body fat to body weight.
Percent Body Fat (%) = Body Fat Mass (㎏) / Body Weight (㎏) × 100
The standard range of Percent Body Fat for males is 10-20%, and 18-28% for females.
4. Segmental Lean Analysis
InBody 270 shows the amount of lean mass in each arm , leg and in the trunk against normal range.
It gives the amount in kg. plus shows if the person is over, normal or under in each segment.
5. Segmental Fat Mass
InBody 270 shows the amount of fat mass in each arm , leg and in the trunk against normal range.
It gives the amount in kg. plus shows if the person is over, normal or under in each segment.
6. Body Composition History
Outlines several parameters over the last 8 measurements.
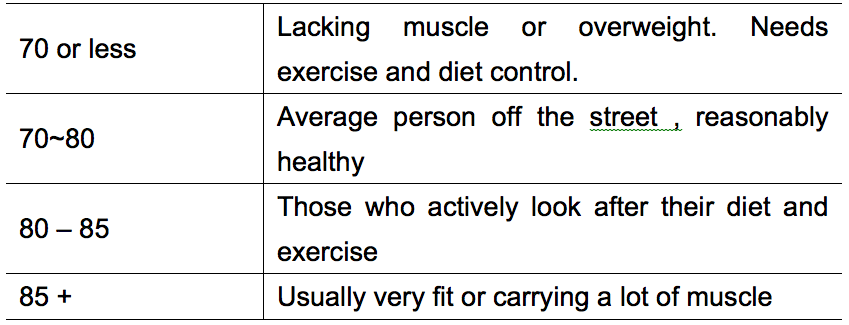
7. InBody Score
Starts off at 80 you then lose points for too much fat or too little muscle, and gain points for more muscle.
Used as a motivational scoring tool. As body composition changes with exercise, the score should increase.
Can be over 100 for very muscular people.
8. Weight Control
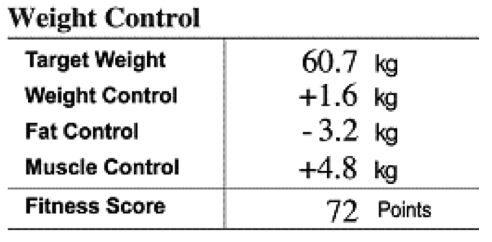 The target weight set by the InBody270 is different from the ideal weight. This is because an ideal weight only considers the height, whereas target weight also takes into account soft lean mass and body fat mass.
The reality is that two people of the same height and weight who have different body compositions will have different target weights.
9. Research Data
Basal Metabolic Rate (BMR) is the minimum amount of energy required to sustain vital functions whilst at rest.
InBody uses a formula(John Cunnigham’s) based on fat free mass rather than just height and weight. This is more accurate and reflects the effect of gaining muscle mass and the resultant increase in BMR when people take up more exercise.
10. Waist-Hip Ratio and Visceral Fat
Waist-Hip ratio (WHR) is determined by dividing the waist circumference at the line of the navel by the maximum hip circumference. It is a useful indicator for looking at the distribution of body fat. InBody570 uses its impedance index to provide an estimation of the persons WHR. Males and Females found to have 0.95 and 0.90 respectively in WHR are considered to suffer from abdominal obesity.
Visceral Fat- Adults who have abdominal obesity tend to have excessive visceral fat (increased fat stored around the abdominal organs internally) and this has been linked with an increased risk of developing cardiovascular disease, High Blood Pressure and Diabetes in later life. This storage of visceral fat can be reversed by exercise and the levels reduced, so it is well worth promoting exercise for the long tern health benefits in later life.
Obesity Degree
Obesity Degree is the percentage above or below ideal weight. Normal range allows for 10% above or below –ie 90-110%. Therefore this person is 3% under ideal weight.
13. Impedance
Shows raw data for each segment – RA-right arm, LA- left arm, TR-trunk, RL-right leg, LL-left leg.
Each column shows numbers for the measurement for each segment at each frequency. As the frequency increases from 5- 50 -500 the impedance values should reduce. If they don’t then there has been a problem with the measurement.